Looking at financial instruments, one often finds the term implied volatility. In this post, we want to describe what it is and what you can do with it. We start refreshing the term historical volatility and then we explain the implied volatility. An example of German DAX with real data concludes this post.
Historical Volatility
Historical volatility measures the deviation of asset returns from their historical average. It is a sample estimate that has time unit and depends on the length of the historical sample period. Denote 


where 


where we have divided the sum of squared deviations by 


Historical volatility can be useful in cases like benchmarking historical performances, assessing the behavior of economic variables, calculating historical risk measures, and so on.
Since historical volatility is the number we get from looking into the past realized data, it may not be as useful when we try to predict the future behavior of asset returns. This is when and why we have the implied volatility, i.e. the volatility number implied from market prices.
Implied volatility
Denote 


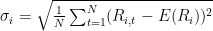
Example: German DAX
The following graphs show the series of VDAX-NEW implied volatility index compared to the DAX historical volatilities. The implied volatility index is a good predictor of the historical volatilities.

(click to enlarge)
We can see that the implied volatility given by VDAX New and the 21-day historical volatility had similar values during the time presented. Most of the time, the implied volatility is slightly higher than the historical volatility.
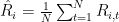
 as predictor of historical 21-trading days volatility")
(Click to enlarge)
The graph above shows the VDAX shifted by 21 days and the 21 day historical volatility. This way, we can see how well VDAX performs as a predictor of the historical volatility. We see that except the unforeseen spikes, implied volatility can be a good predictor of (future) historical volatility. Now, a similar graph with 1 year time horizons:
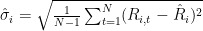
")
(click to enlarge)
With a one year horizon, the relationship between historical volatility and implied volatility is not that obvious.
An in-depth study of the predictability of historical volatility by implied volatility can also be found here in Wilmott Magazine.
Conclusion
While the historical volatility describes the size of the variations of the past, the implied volatility describes the size of the variations of the futures, implied by the traded option prices.

Fake Oakley Furious II Oakley Oil Rig 048
There are some used tanning beds out there that are as good as new at a fraction of the cost. Markets are becoming more specialized as consumers become more sophisticated and also see Wholesale Furniture On Line, and get more info on Wholesale Sterling Silver Beads Hill Tribe. It’s as easy as an email or phone call and your order is all set and ready to be shipped. It is recommended to check the written policies and the reputation of the store before closing a deal. Whichever solution you decide to pick one of the best places to purchase is from World Wide Brands. 1. Did you ever wanted to start a business? Chances are that any business will have something to do to with the “wholesale business”. Fake Oakley Furious II Oakley Oil Rig 048