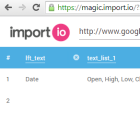
Since I am always looking for new handy tools, I found a cool way scraping data from websites: “Magic” from import.io Ltd.
Since I am always looking for new handy tools, I found a cool way scraping data from websites: “Magic” from import.io Ltd.

Last time we looked at implied volatility, we found a close relationship between historical volatility and implied volatility. This time, we want to look at the relative changes of DAX and VDAX and their relationship.

On July 1st, 1988 German DAX was published. It was not only an index of the German stock market: It introduced a new methodology computing a stock market index. The German DAX was the first popular index to include weights according to market capitalization and calculating returns including dividends. Now, after 25 years it is […]
Often you find studies how well a specific fund or trading strategy has performed. You must be aware of the fact that basically all studies based on historical data lie – or at least do not tell the full story. There are two highly underestimated effects: Survivor bias and fat tails. Both effects make poor […]
For data analysts like myself, one of the most useful pages on any blog resides on this website. The comprehensive list of data sites Andreas put together is indispensable because finding numerical data online, even though it is abundant, is so difficult and time consuming.

Looking at financial instruments, one often finds the term implied volatility. In this post, we want to describe what it is and what you can do with it. We start refreshing the term historical volatility and then we explain the implied volatility. An example of German DAX with real data concludes this post. Historical Volatility […]

There are many free data sources: In a previous post, I published a list a free market data sources. Now, I would like to point you to an interesting project: WIKIPOSIT. This project aggregates many data sources such that you can access market data and other statistics with a simple API. Or, you can export […]

Before using specialized tools for back-testing I propose that one tries the MS Excel Pivot Table first. The pivot table tool is great for inspection, filtering and analyzing large data sets. In this article, I will present how to create a simple timing-based strategy and how to compute its historical performance.

Sell in May and go away is an old wisdom which is interesting to analyze. And the continuation “Remember to come back in September” completes this wisdom to a real trading strategy. This strategy is quite old. Many sources say that the original saying comes from traders in the City of London and was “Sell in May […]

Often people ask me where they can find historical data of stock prices, commodities, interest-rates, bonds, fx rates … . In previous posts, we already looked at live data feeds for Matlab, and Excel. Then, we looked at how to load historical data. Now, we want to focus on where to get the data itself.

In the last decade, gold constantly rose in value. In this post, we will use public data to look into the value relationship of gold and money. Value of gold measured in different currencies Gold is definitely one of the oldest currencies. Until 1971, USD and gold were essentially the same using a fixed conversion rate. […]
There is an interesting and brand new project from The MathWorks: Trendy.

A brilliant website is the perfect example for user friendly interactive data visualization: Gapminder. This website presents statistical data about the countries of the world and how it changes in time. A user-friendly AJAX user interface allows you to get gain new insights exploring this data. They have done a great job. Google bought this […]
This is a though one… Everybody wants real time market data – in MS Excel, in Matlab, in Java, in Theta Suite etc. But, obtaining market data is very hard and cost intensive because the stock exchanges do not want to provide real-time data for free. Ok, but what can you do about it?
This is a very important and usual task. Historical data is mainly required for risk management purposes, model validation and back-testing. For these tasks software systems like Theta Suite, Matlab, Java or Excel are the main work space. We need to import the data here.
