Did you know that your favorite Powerball number might be everyone else’s favorite too? Discover how the numbers you choose could mean sharing your jackpot with strangers. In German Lotto, this is even more crucial, because the payout of German Lotto depends on the number of winners in each cathegory.

Introduction
Many people dream of winning the big Powerball lottery jackpot. They pick numbers hoping to be the lucky ones. But, what if the numbers you choose are also chosen by lots of other people? You might have to share your big win with them.
In this blog post, I look into the Powerball lottery and the numbers people choose. I found out that some numbers are picked a lot more than others. This could mean if those numbers win, more people have to share the money.
I used data to see which numbers are played the most and the least. This can help you pick numbers in a smarter way, maybe even giving you a better chance to win all by yourself. A neat trick with MS Excel Pivot tables allows to find out which numbers the other players are playing.
If you play Powerball or just want to know more about how people pick their numbers, you’ll find this interesting. Let’s find out how to pick numbers that not everyone else is picking.
Methodology: How to Analyze the Numbers
To understand how people pick their Powerball numbers, I took a close look at the winning statistics:
Where We Got the Data:
- Winners Data: We used the official Powerball website (https://www.powerball.com) to get information on the number of winners for each category. This data covers drawings from January 13th, 2016, to March 27th, 2024. This means we looked at all the numbers that won during this time.
- Ticket Sales Data: To understand how many people are betting on Powerball, we checked out data from https://lottoreport.com/PBSalesbystate.htm. This website gave us insights into how many tickets were sold, which helps us see how popular certain numbers are.
- German Lotto Data: Includes winning combinations together with ticket sales https://www.sachsenlotto.de/portal/zahlen-quoten/gewinnzahlen/download-archiv/gewinnzahlen_download.jsp so, I can compare the results with a different lottery.
Analyzing the Data:
- Pivot Tables: To make sense of all this information, I used a special trick with pivot tables. For every Powerball drawing, there are 5 winning numbers. So, I made sure our table had 5 rows for each drawing, one row for each of the winning numbers. This setup lets us see not just which numbers win, but also how often they are chosen. Looking at winning pairs, I created sheets with 25 rows for each drawing: One for each combination and one for the repetition of the same ball, replicating the result where we look at a single ball drawn.
- Frequency and Popularity: By comparing the winners’ data with how many tickets were sold, we could see which numbers are favorites.
Sharing the Data:
I believe in sharing knowledge. That’s why I am putting all this data into MS Excel spreadsheets for anyone to look at and analyze. This way, you can play around with the data yourself and maybe discover your own winning strategy.
powerball.xlsx
LOTTO_Pivot.xlsx
Note that the Pivot tables cannot be changed in the web-based MS Excel. You need to copy and download the file.
Overview of Powerball Number Preferences
When playing the Powerball, picking the right combination of numbers is everything. Not only do you want your numbers to win, but you also want to avoid sharing your jackpot with too many people. We’ve looked into the numbers—from the five main balls to the all-important Powerball—to see which ones are more likely to be winners and how often they might be shared.
Main Numbers (1 to 69):
Our analysis of the main five Powerball numbers shows that if some specfic numbers are drawn, more tickets win per game than with other numbers.
Looking at the numbers of winners with 3 correct balls, having a 7 in the 5 drawn numbers, the fraction of winners is 3.8E-04 or 0.038%. At the same time, having a 65 in the 5 drawn numbers, the fraction of winning tickets shrinks to 0.031%. That means that many more people chose 7 on their powerball ticket than 65. Here is the full overview:

Note that the analysis does not present the fraction of people that have chosen e.g. 7 on their Powerball ticket, but the number of people that have 3 out of the 5 balls correct where one of the 5 balls is 7.
Now, what about number pairs? What are the combinations played by Powerball players? Therefore, let us look at the fraction of winners with 3 correct balls. The following graphic shows for each pair of balls where there are many winners in red where there are few winners in green.

The above image shows that many players prefer a combination of balls where one ball is in 1-12 and the second ball is in 1-30/31. I call these bets “birthday bets”. Combinations with 13-69 and 13-69 are much rarer.
The Powerball (1 to 26):
Choosing the Powerball number is crucial and can dramatically affect your share of the prize. Number 7 stands out as a common winner with the highest fraction, indicating it’s a popular choice and might lead to more shared jackpots. Numbers like 1, 2, 20 and 23 have lower fractions of winners, hinting they might be less popular and could result in a bigger individual prize if you win the Jackpot.

Unifying Strategy:
What’s the takeaway for choosing your Powerball numbers? If you want to avoid sharing the jackpot, consider opting for main numbers and a Powerball number that have historically been on fewer winning ticket fraction. While this doesn’t increase your chances of winning, it could mean fewer people to split the prize with if your numbers hit. Remember, every number has an equal chance of being picked in the draw. These insights are about playing the odds of having a unique ticket that others might not have, aiming for the joy of winning big and winning alone.
International Observations (Lotto in Germany)
Using the same methodology for the German Lotto, we get some more insights. Lotto in Germany is a draw of 6 balls from 1 to 49 and 1 additional number SZ from 0 to 9. Klasse 1 means all regular 6 balls and SZ match the players bet. Klasse 2 means, all regular 6 numbers match, down to Klasse 8 where 3 regular numbers match.
Looking at Figure 4, the fraction of winning tickets for each number drawn, similar to Figure 1, we can see that left and right borders are chosen seldomly. This is much different from the Powerball analysis in Figure 1.

I think that the German Lotto is different because of the ticket layout. There are several layout for Powerball, but the layout for Lotto is always a 7×7 table. So, many player might not want to bet an numbers at the border.
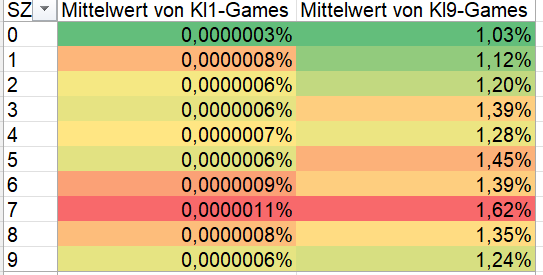
And for the Superzahl (SZ): 0 is least popular and 7 is most popular. So, better choose 0,1,2,3 if you do not want to share the Jackpot in Klasse 1.
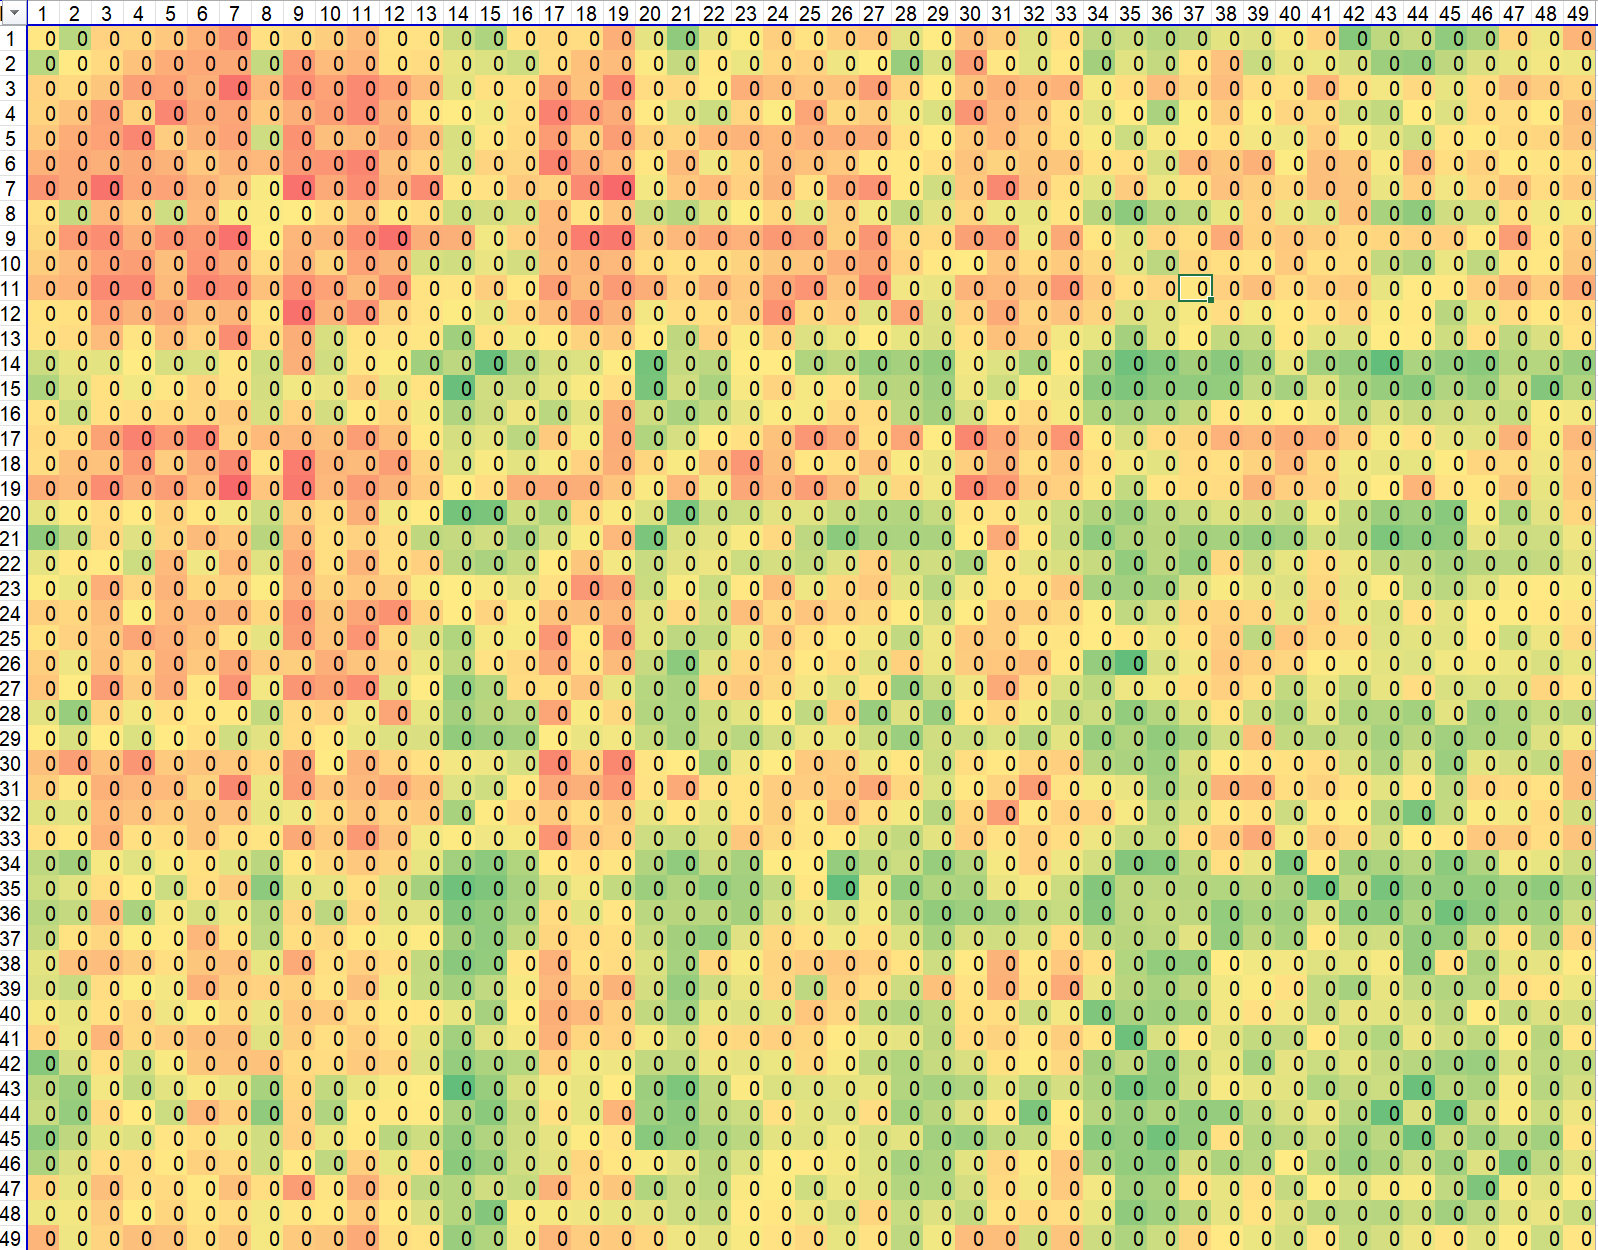
How about number pairs in German Lotto? Figure 6 shows the fraction of winners given the number pair (row/column). Similar to Powerball in Figure 2, we can see the “birthday bets” 1-12 and 1-30/31. However, there is a green pattern on bottom right which somewhat repeats each 7 numbers. This is border effect which we saw already in Figure 4.
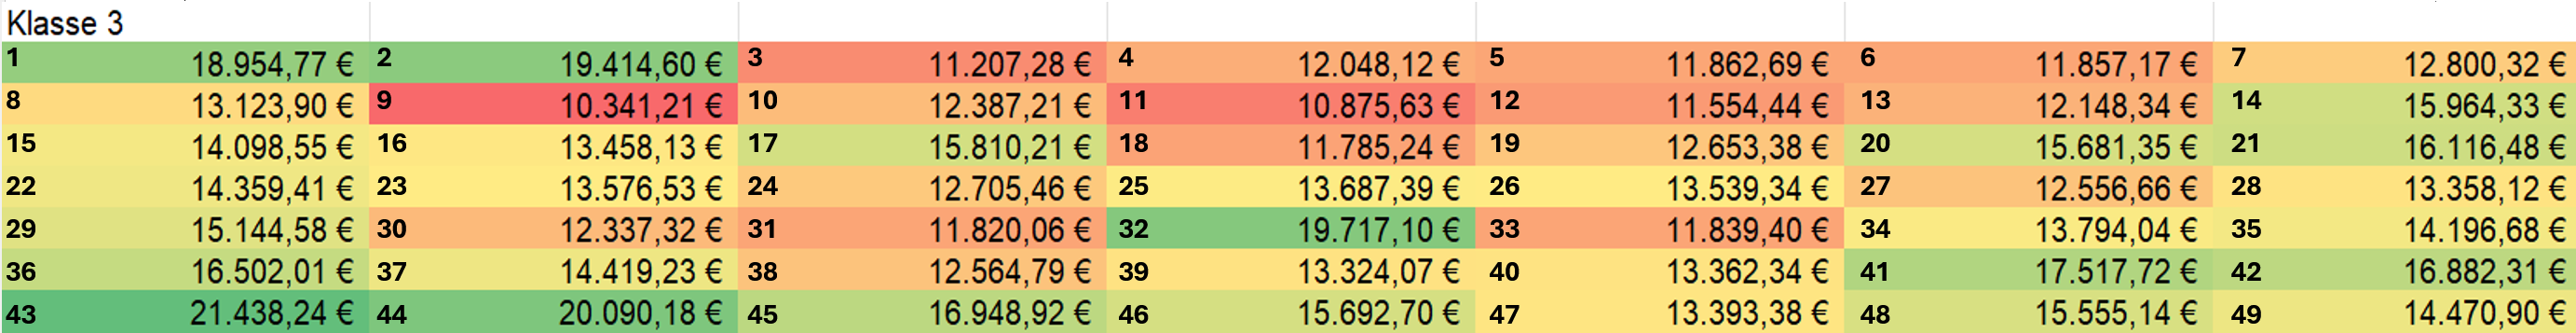
How big is this effect? For German Lotto, I can quantify effect size choosing a specific number and the results are presented in Figure 7. You can see that the payout in Klasse 3 having 43 in your ticket compared to number 9 is doubled from 10,341€ to 21,438€.
Conclusion: Navigating the Powerball with Insight
As we’ve journeyed through the numbers, trends, and psychological underpinnings of the Powerball, it’s clear that the way we choose our lottery numbers is more than a game—it’s a reflection of our hopes, behaviors, and strategies. While every number drawn is the product of chance, our choice in numbers can dramatically alter the outcome, not in terms of winning, but in how we share the Jackpot.
My analysis has revealed that certain numbers come with a higher likelihood of being shared among winners, particularly those with personal significance like dates or those that follow a recognizable pattern like the center of the lottery ticket. So, you might want to avoid the top line of the lottery ticket, especially the number 7. Then, you will be
So, should you follow the crowd or chart your own path? If the goal is to avoid splitting your jackpot, the data suggests steering clear of popular picks might be the way to go. But let’s not forget, the essence of Powerball lies in its unpredictability and the thrill it brings with each draw.

Isabella Belle
Wondering When Is The Next Powerball Drawing? Stay updated with the latest Powerball schedule to never miss your chance at winning. Drawings are held multiple times a week, find out the exact time and date now!